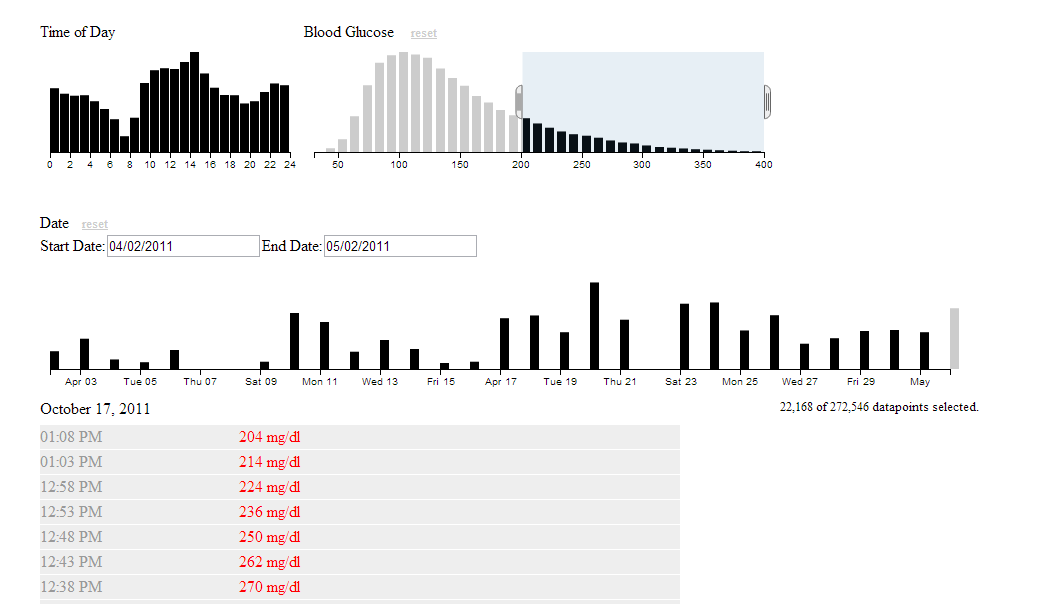
This visualization is applying the d3 crossfilter visualization on data from a continuous glucose monitoring (CGM) device. It allows users to filter on blood glucose level, times of the day, and date ranges.
For example in the image below, the user to looking to answer the question “What times of the day am I hyperglycemic?”Link to Demo